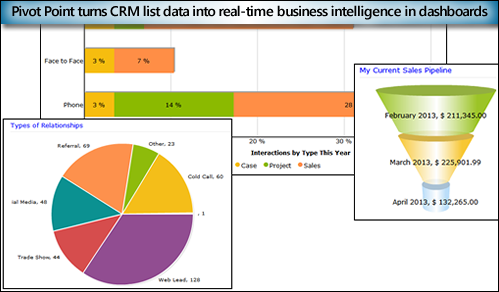
Our PivotPoint web part for SharePoint allows you to summarise data from your SharePoint lists in a similar way to Excel’s Pivot Tables and Charts.
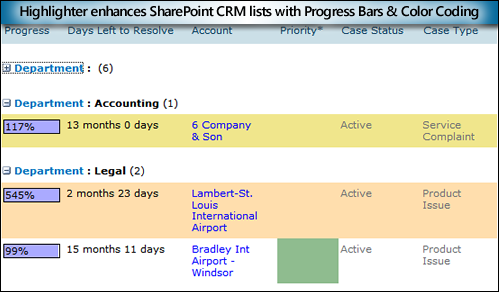
A few users have asked how you can add highlighting or conditional formatting to the Pivot Tables – to do things like highlighting the High Risk column, or any cell above a certain value.
We have a Highlighter app that allows you to do this on normal Lists but it doesn’t work with PivotPoint so I thought I would put together some examples of how you can do this using every SharePoint hackers favourite tools – JavaScript and jQuery.
You will need some experience with programming and/or JavaScript to be able to modify these examples to do what you want but there are lots of comments in the code to help.
If you’re looking for an easy way to add conditional formatting/ highlighting for SharePoint Lists then check out Highlighter.
So lets get started. The files you need for the article can be found in a zip file here. Inside you will see a test .html page that can be used just to experiment with the javascript and a .js.txt file that contains the javascript to use on your site.
Adding JavaScript to a page
The first thing we need to know is how to add JavaScript to a page. Read up about that and come back!
In SharePoint 2013 you can add a Script Editor web part (under Media and Content). This blog post walks you through.
For SharePoint 2010 and 2007 you have to use the Content Editor web part (CEWP)
You could use the Source View of the CEWP and put the JavaScript directly into it, but you could also staple your tongue to a door and it will probably be less painful!
A much better way is to save the script as a .txt file in a document library and then include the file on the page with the Content Editors “Content Link” feature. Christophe walks you through this method here.
jQuery or not?
The examples given here use jQuery – a great addition to JavaScript that simplifies many common tasks.
You could adapt these ideas to run without jQuery if you like – but you’re on your own with that!
You can see the reference to jQuery on the first line of the example scripts.
One thing you should determine is
a) Has jQuery already been added to all your SharePoint pages (by an administrator adding them into a custom master page)? If so then you should remove the jQuery reference from these examples as there is no point in including it twice.
b) These jQuery files are loaded from Googles CDN servers. If you don’t have external internet access you will have to copy jQuery to some other location (such as a document library).
Show me the examples already!
Download and unpack these zip files – inside you will see
.htm files that you can experiment with.
Open them in a browser to see what they look like. Open them in a text editor like Notepad to change how they look and then re-load in the browser (F5).
.js.txt files that you can use in SharePoint.
Use a text editor to copy the changes you’ve made in the example .htm file in and then add them to the page that you have PivotPoint on using any of the methods in “Adding JavaScript to a page”.
The two examples are :-
Highlighting PivotPoint cells based on the value
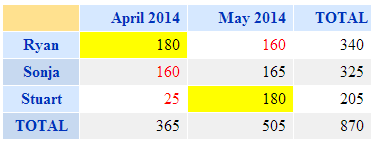
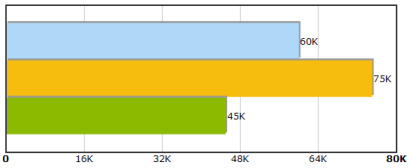
The first example we’re going to look at is to highlight different cells depending on the value that’s in them.
For our example –
- If it’s less than or equal to 160 then we want the text in red
- If it’s more than or equal to 180 then it should have a background in yellow.
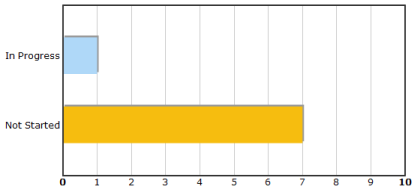
The result should be a web part like this.
There are plenty of comments in the JavaScript source code but basically what it’s doing Is looping through each cell in the PivotTable, checking what value It is and applying a CSS style.
See the source of highlight-by-cell-value.html and highlight-by-cell-value.js.txt in the ZIP file
Highlighting PivotPoint based on the row and column
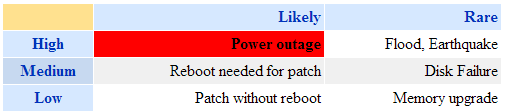
In this example we’re looking to highlight a cell based on what Row and Column it appears in.
E.g. in this risk matrix we want to highlight the “High Risk” and “Frequent Probability” in red.
There are two ways to do this in the javascript example given.
The first is to highlight based on the position, e.g.
highlightCellByIndex(0,0,'background','red');
Will highlight the cell in column 0, row 0 by setting the background red. (Yes sorry, the rows and columns start from number 0!).
But – if the layout of your table changes in future (e.g. someone adds a “Super Extra High Risk”) column) then everything will move and this will be in the wrong place.
In that case the better way is to highlight by the value of the Column and Row headers – e.g.
highlightCell("Rare","Low", 'background','red');
See the source of highlight-by-column-and-row.html and highlight-by-column-and-row.js in the ZIP file
Tips –
- When making changes to the javascript do a small amount at a time, then you will know where to start if this doesn’t work!
- You’re not just limited to setting colours, you can also add in any other effect possible in CSS.
- Use the developer toolbar (F12 in IE and Chrome) if you have an error – this tool will enable you to track it down, but how to use it is beyond the scope of what we can show here!
.css('font-weight','bold');
.css('font-size','200%');
.css('border','1px solid red');
- You can also add images (e.g. flags)
.append("<img src='some-url-to-an–icon.gif'>");
Disclaimer – these technique is provided as is and free of charge to get you started. You will need some experience of JavaScript or programming and the browser developer tools to modify these to do exactly what you want. Whilst we can’t provide technical support for this we will endeavour to help customers with active Premium Support and Maintenance contracts in place for PivotPoint.


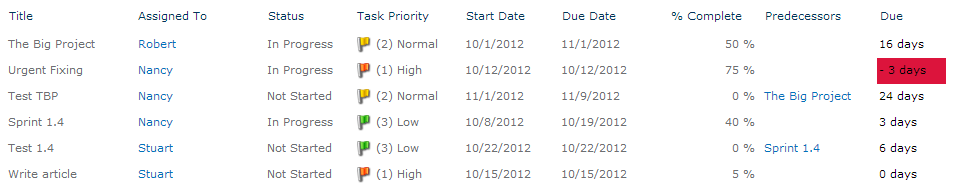
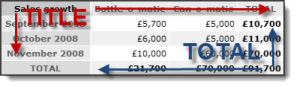
 Name the column Due