Archive for the ‘SharePoint Ideas’ Category

SPBiz – SharePoint conference for Business and Power Users!

Date:June 9th, 2015 Author: Tags: , , , ,
Category: SharePoint Ideas, SharePoint Online / 365 / Cloud, Training Comments:3 ;

As with any technology a successfully SharePoint implementation relies just as much on the business and ‘softer’ user adoption skills as the technical aspects. Which is why I’ve always found it strange that there are huge amounts of great technical resources (books, examples, best-practices, blogs, conferences etc) but far less aimed at business and power users.

The free on-line SPBiz conference is going to balance this a little with its focus on the needs of SharePoint Business and Power Users. There is still some great technical content in there but the focus is on empowering the less technical audience with resources to get things done and make SharePoint a success.

Just some of the sessions at SPBiz!

  • Create a GTD Dashboard in Office 365 to “Get Things Done”
  • Want to use SharePoint for internal communications?
  • Secrets of Successful SharePoint Intranets
  • How to build a knowledge sharing culture
  • Strategies to Deliver Successful Employee Portals
  • Leverage SharePoint 2013 for Better Collaborative Project Management
  • How to be productive with Office 365
  • Change business processes into easy SharePoint workflows
  • Find out about the best “no-code” solutions for SharePoint
  • SharePoint Governance 101

June 17th and 18th – Free and Online.

Register Today for free or browse the Agenda for Wednesday 17th and Thursday 18th.

SPBiz-MastHead

SharePoint Designer 2013 – How to modify List View web part filters and parameters

Date:May 30th, 2014 Author: Tags: , , ,
Category: Filter, FilterPoint Web Part, General, SharePoint Development, SharePoint Ideas Comments:18 ;

SharePoint Designer is especially useful for things like setting up complex filters and parameters for List View web parts like ‘wildcard’ searches and ‘before or after a date’ filters.

In SharePoint Designer 2013 (SPD 2013) the “Design View” was (controversially) removed so now it’s a little harder to use as you have to wade through some X/HTML soup. There is also a bit of a wicked bug that’s going to trip you up as well so in this post I am going to give a few tips on how get to the Parameters and Filters options in the ribbon menu.

SharePoint Desinger 2013 - Filter and Parameters

Note –this post is NOT a tutorial on how to use SharePoint Designer (its complex and worth a whole book in itself) but just a few tips for those already familiar with using SPD on how to do use the 2013 version. It won’t put back all you’ve lost, just allow you to access the Parameter & Filter options.

Missing Designer View and finding the List View Web Part

When you edit a page the most obvious difference in SPD 2013 is that you don’t get a Design View (the WYSIWYG view that allows you to see how the page will look whilst editing it). Instead you’ve only got the code view and you’re going to have to work through some angle bracket gibberish!

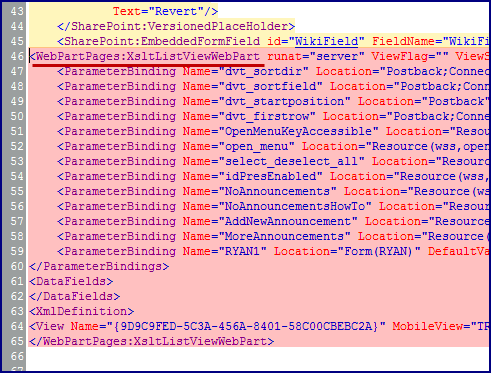
You’re looking for the code that defines the list view – it starts with <WebPartPages:XsltListViewWebPart and ends with </WebPartPages:XsltListViewWebPart> (pink in the pic here).

SharePoint Designer 2013 - how to find List View Web Part LVWP in code view

But save your eyes! Just search (CTRL+F) for XsltListViewWebPart! If the cursor is between the two XsltListViewWebPart tags then this is the same as clicking on the List in the old Design / Split view.

(If there are more than one List View on the page you will have to figure out which is which by the position of the web part in the page or look for the URL listed in TitleUrl, DetailLink or Url)

Getting the List View Tools options to show in the Ribbon

After putting the text cursor (or clicking) in the code that makes up the List View web part the ribbon should show the List View Tools option.

Except… there is a wicked bug in SPD 2013 at the time of writing that means the Ribbon doesn’t update to show the Options menu (unless you’ve turned off Server Rendering).

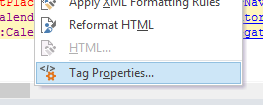
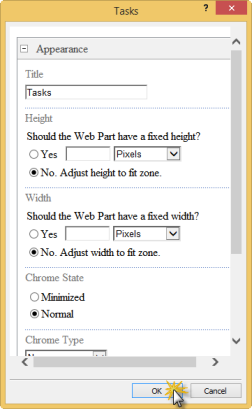
The trick (given to me by MdMazzotti) is to right click on XsltListViewWebPart then select Tag Properties and then click OK without clicking anythingSPD - Tag PropertiesYou will now have access to the List View Tools > Options ribbon and the Filter and Parameters button (see picture at the top of this page) SPD - Web Part Properties

You can view these steps in a video :-

Unable to display content. Adobe Flash is required.

Add Highlighting & Conditional Formatting to PivotPoint tables

Date:March 12th, 2014 Author: Tags: , , , , ,
Category: PivotPoint Web Part, SharePoint Ideas Comments:1 ;

Our PivotPoint web part for SharePoint allows you to summarise data from your SharePoint lists in a similar way to Excel’s Pivot Tables and Charts.

A few users have asked how you can add highlighting or conditional formatting to the Pivot Tables – to do things like highlighting the High Risk column, or any cell above a certain value.

We have a Highlighter app that allows you to do this on normal Lists but it doesn’t work with PivotPoint so I thought I would put together some examples of how you can do this using every SharePoint hackers favourite tools – JavaScript and jQuery.

You will need some experience with programming and/or JavaScript to be able to modify these examples to do what you want but there are lots of comments in the code to help.

If you’re looking for an easy way to add conditional formatting/ highlighting for SharePoint Lists then check out Highlighter.

So lets get started. The files you need for the article can be found in a zip file here. Inside you will see a test .html page that can be used just to experiment with the javascript and a .js.txt file that contains the javascript to use on your site.

Adding JavaScript to a page

The first thing we need to know is how to add JavaScript to a page. Read up about that and come back!

In SharePoint 2013 you can add a Script Editor web part (under Media and Content). This blog post walks you through.

For SharePoint 2010 and 2007 you have to use the Content Editor web part (CEWP)

You could use the Source View of the CEWP and put the JavaScript directly into it, but you could also staple your tongue to a door and it will probably be less painful!

A much better way is to save the script as a .txt file in a document library and then include the file on the page with the Content Editors “Content Link” feature. Christophe walks you through this method here.

jQuery or not?

The examples given here use jQuery – a great addition to JavaScript that simplifies many common tasks.

You could adapt these ideas to run without jQuery if you like – but you’re on your own with that!

You can see the reference to jQuery on the first line of the example scripts.

One thing you should determine is

a)      Has jQuery already been added to all your SharePoint pages (by an administrator adding them into a custom master page)? If so then you should remove the jQuery reference from these examples as there is no point in including it twice.

b)      These jQuery files are loaded from Googles CDN servers. If you don’t have external internet access you will have to copy jQuery to some other location (such as a document library).

Show me the examples already!

Download and unpack these zip files – inside you will see

.htm files that you can experiment with.

Open them in a browser to see what they look like. Open them in a text editor like Notepad to change how they look and then re-load in the browser (F5).

.js.txt files that you can use in SharePoint.

Use a text editor to copy the changes you’ve made in the example .htm file in and then add them to the page that you have PivotPoint on using any of the methods in “Adding JavaScript to a page”.

The two examples are :-

Highlighting PivotPoint cells based on the value

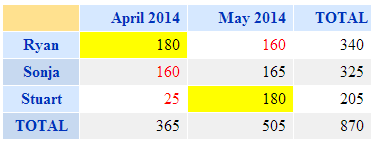
The first example we’re going to look at is to highlight different cells depending on the value that’s in them.

For our example –

  • If it’s less than or equal to 160 then we want the text in red
  • If it’s more than or equal to 180 then it should have a background in yellow.

The result should be a web part like this.
highlight-by-cell-value

There are plenty of comments in the JavaScript source code but basically what it’s doing Is looping through each cell in the PivotTable, checking what value It is and applying a CSS style.

See the source of highlight-by-cell-value.html and highlight-by-cell-value.js.txt in the ZIP file


Highlighting PivotPoint based on the row and column

In this example we’re looking to highlight a cell based on what Row and Column it appears in.

E.g. in this risk matrix we want to highlight the “High Risk” and “Frequent Probability” in red.

risk-matrix

There are two ways to do this in the javascript example given.

The first is to highlight based on the position, e.g.

highlightCellByIndex(0,0,'background','red');

Will highlight the cell in column 0, row 0 by setting the background red. (Yes sorry, the rows and columns start from number 0!).

But – if the layout of your table changes in future (e.g. someone adds a “Super Extra High Risk”) column) then everything will move and this will be in the wrong place.

In that case the better way is to highlight by the value of the Column and Row headers – e.g.

highlightCell("Rare","Low", 'background','red');

See the source of highlight-by-column-and-row.html and highlight-by-column-and-row.js in the ZIP file

Tips –

  • When making changes to the javascript do a small amount at a time, then you will know where to start if this doesn’t work!
  • You’re not just limited to setting colours, you can also add in any other effect possible in CSS.
  • Use the developer toolbar (F12 in IE and Chrome) if you have an error – this tool will enable you to track it down, but how to use it is beyond the scope of what we can show here!
.css('font-weight','bold');
.css('font-size','200%');
.css('border','1px solid red');
  • You can also add images (e.g. flags)
.append("<img src='some-url-to-an–icon.gif'>");


Disclaimer – these technique is provided as is and free of charge to get you started. You will need some experience of JavaScript or programming and the browser developer tools to modify these to do exactly what you want. Whilst we can’t provide technical support for this we will endeavour to help customers with active Premium Support and Maintenance contracts in place for PivotPoint.


Free online SharePoint conference – SP24

Date:January 24th, 2014 Author: Tags:
Category: Community, SharePoint Ideas, Training Comments:0 ;

The team over at SharePoint-Community.net are organising their first on-line conference – SP24.

It runs on Wednesday 16th April, 2014 from 10pm GMT for 24 hours.

There are two tracks – Business and Technical focused and each track has one session per hour. There are some great speakers lined up already and more being voted in by the community.

Its totally free to attend – just hop on over and register.

Key Facts

  • Free for all attendees.
  • It’s entirely on-line – so you won’t need to leave the office or home!
  • Takes place on 16th April 10pm GMT.
  • Lasts for 24 hours.
  • Famous speakers from all over the world.
  • Keynote from Bill Baer (Senior Product Manager, Microsoft).
  • Comprises of 2 tracks, (business and technical).
  • 48 Live sessions + on-demand sessions.

Find out more and register at https://www.sp24conf.com/

Complete guide to filtering SharePoint lists by the current week.

Date:September 17th, 2012 Author: Tags: , ,
Category: Calculated Columns, Filter, SharePoint Ideas Comments:7 ;

A common requirement in SharePoint is to filter lists so you’re only showing the current week, month, quarter etc. If you only want to see the last X number of days (e.g. last 30 days) then it’s simple enough.

If you want setup a SharePoint view to see the current calendar week then its a little more complex – especially if you define your week differently from the standard Sunday to Saturday or Monday to Sunday.

First you must look at and really understand the method for setting up SharePoint views to filter the current calendar month or week as it’s not really obvious.

Long story short – here are the steps :-

  • Use one of the calculated column formula below to find the “Start of week
  • Use a calculated column formula of “End of Week
        = [Start of Week] + 6
  • Setup a View Filter showing items when [Today] is in that range.
        Start of Week <= [Today] AND End Of Week >= [Today]

Again – see this post for showing the method in step-by-step detail.

If your week goes Sunday to Saturday or Monday to Sunday then use :-

Start of week End of week
Sunday to Saturday
 =[Due Date] - WEEKDAY([Due Date]) +1
 =[Start of Week] + 6
Monday to Sunday
 =[Due Date] – WEEKDAY([mydate],2) + 1
 =[Start of Week] + 6

Obviously you will replace [Due Date] with your own particular date field.(Check out the WEEKDAY function to understand what the 2nd argument does)

The other options are a bit more complex to find the start of the week (again end of week = start + 6)

Start of week
Tuesday to Monday
 =[Due Date]-WEEKDAY([Due Date])+IF(WEEKDAY([Due Date])<3,-4,3)
Wednesday to Tuesday
 =[Due Date]-WEEKDAY([Due Date])+IF(WEEKDAY([Due Date])<4,-3,4)
Thursday to Wednesday
 =[Due Date]-WEEKDAY([Due Date])+IF(WEEKDAY([Due Date])<5,-2,5)
Friday to Thursday
 =[Due Date]-WEEKDAY([Due Date])+IF(WEEKDAY([Due Date])<6,-1,6)
Saturday to Friday
 =[Due Date]-WEEKDAY([Due Date])+IF(WEEKDAY([Due Date])<7,0,7)

See this picture for some test data, its in a strange order (Thursday to Wednesday if first) but check it out on your desk calendar if you’re not convinced!

Thinking Sideways About Highlighter

Date:September 15th, 2011 Author: Tags: , , , , ,
Category: Highlighter, SharePoint Ideas Comments:0 ;

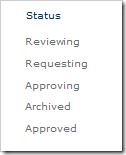
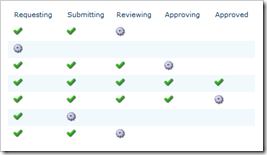
You may have caught Clare’s post earlier about Highlighter’s recent performance enhancements, that were mostly due to some of the surprising ways we’ve seen it being used in the wild. To illustrate this sideways thinking (lateral and literal) we’ll take a look at exploding a humble status column into an Approval Progress Overview:

Status overview

As you can see, we now have a quick at-a-glance idea of how the projects are doing. To create this view, a Highlighter column has been added for each of the statuses. In each of these columns we’ve set it up to display icons (cell color is also a good choice), and cleared the default. Let’s take the Approved status as an example:

Icon setup

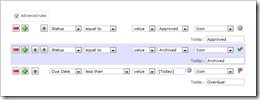
All we need to do is click the Auto-create button to create some rules, remove those for the earlier statuses, change the later ones to green icons, and this column’s status of interest to a working icon:

Rules

Just to keep people on their toes lets add a little urgency to the list with a Due Date column. So now we want to change the Approved column to a red icon if the Due Date has passed, and the status isn’t yet Approved. This is done by switching to Advanced mode and adding a single rule:

Due date rule

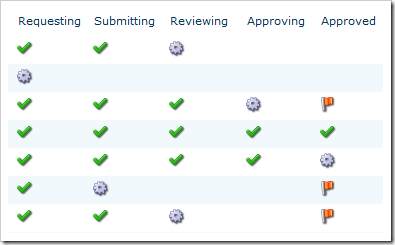
Here are the results of that extra change:

Overview (with due date)

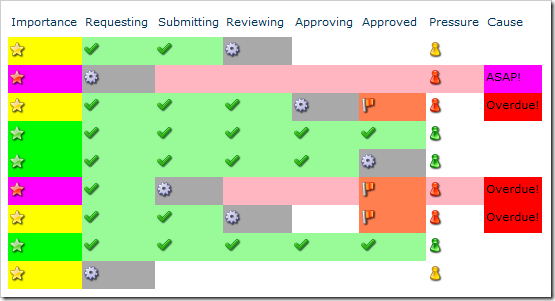
If that wasn’t enough for you, here’s the weaponized version of Highlighter featuring cell colors, priority icons, and Project Manager Blood Pressure indicator:

weaponised

We’re always interested to hear what you’ve done with our products (especially Highlighter); so if you’ve done something even scarier than the above, send a screenshot to [email protected].

SharePoint Highlighter – color coding date ranges based on [Today]

Date:August 17th, 2011 Author: Tags: , , ,
Category: General, Highlighter, SharePoint Ideas Comments:2 ;

It is sooo much easier to keep on top of your tasks if you can see at a glance what is due when.

Tasks Highlighted by due date


It’s easy to add this color coding to your SharePoint lists with SharePoint Highlighter in just a few clicks, but setting up the rules correctly is a bit of a mind-bender, so in this post we are going to show you how.

So above you can see:

  • Tasks due in less than 7 days highlighted in orange
  • Tasks due in 7-14 days highlighted in yellow.
  • Tasks due in more than 14 days highlighted in green.

So first add a Highlighter column to your list:

http://www.pentalogic.net/sharepoint-products/highlighter/h-manual/h-configuration

Give it a name – I’ve called mine “Due When”.

From the 3 Highlighting Styles choose Highlighting, and choose to Highlight Rows, though this method would work equally well with icons or cell highlighting.

As we are highlighting the whole row we don’t really need to see the actual Highlighter column, so choose to put this to the right of the view, out of the way.

If we were using Auto Setup Rules we would now base the Highlighter column on your Due Date column – this is where it would get its information from.  But what we want to do is a bit too complex for the Auto Setup, so you can leave this box blank and go straight to to the Advanced Rules – click Add Custom.

Scary!  Not really, we just need to think logically about when we are trying to achieve.

The main thing you need to remember is that Highlighter will apply the first rule it finds that is true.  Once it has applied one rule to a row, it will ignore all other rules.

So to get the Highlighting shown above we need this setup:

So, when Highlighter checks the list, first it checks to see if the item’s due date is less than 7 days after today, if it is Highlighter colors the row orange and moves on to check the next list item.  If this rule isn’t met Highlighter checks to see whether the item’s due date is less than 14 days after today, and so on.

It’s all a matter of getting your rules in the right order.  So for example, if we change the order of the rules so the 14 day rule comes first, like this:

This is what happens to the list:

As you can see we have lost our orange highlighting for items that are “Due in Less than 7 days”.  Because Due in less than 14 days is now at the top of our list of rules this is what Highlighter is checking for first, so it is missing the more urgent items.

It’s all about getting your rules in the right order, and as you can see, Highlighter gives you the ability to move items up and down the list with the up/down arrows, or insert or delete a rule at any point.

I hope this has helped to make sense of the advanced rules, and if you have any scenarios that you would like us to work through for you then we would love to hear from you.

SharePoint Pivot Charts and Tables – Quick and Easy Video Demo

Date:July 15th, 2011 Author: Category: General, PivotPoint Web Part, SharePoint Ideas Comments:0 ;

It’s all too easy to say that a piece of software is “intuitive” or “Quick and Easy” to use. But what’s quick and easy for me could quite possibly be mind bogglingly slow and tricky for you.

So to show you just how quick and easy it really is to set up dynamic Pivot charts and tables in SharePoint using PivotPoint web part we have produced a 4 minute video demo which walks you through the set up.

The video:

  • walks you through setting up a pivot chart from SharePoint list data,
  • shows you how the chart or table you have created provides a drill-down to a filtered view of your list data, and
  • shows you how your charts and tables update dynamically as you list data changes.

Take a look and if you think you could make use of PivotPoint on your SharePoint site why not try it out with a 30 day free trial.

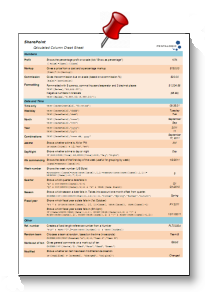
SharePoint Calculated Column Cheat Sheet

Date:May 19th, 2011 Author: Tags: ,
Category: Calculated Columns, SharePoint Ideas Comments:18 ;

Calculated columns are a really useful feature of any SharePoint list.

Whether you want to automatically show the profit on a sale, or the financial year that a date falls in to, or tidy up sloppy user input by capitalising names.  There is a lot you can do it with a Calculated Column.

But remembering the formulas and functions needed is not always easy, especially before the first coffee of the morning.  I know there is a way to get rid of the decimal places on a number but is it TRUN, or TRUNC, or TRUNK – oh no, hang on, that last one is just to do with elephants!

So, over the years we’ve gathered together a quick reference of some of the most commonly used functions and formulas – stuck on a wall above the desk it saves a lot of time and head scratching.  We’ve found ourselves sending it to clients from time to time, and they seem to find it quite handy too.

So we decided to tidy it up – clean off the coffee stains and make a nice PDF of it – and make it available to download, free – yes that’s right, FREE!

So why not download our free Calculated Column Cheat Sheet and save yourself some time and headaches?  This easy 3 page reference sheet gives you a selection of commonly used calculated column formulas, along with a pretty thorough reference of most of the functions and operators you are likely to need in your day to day work.

Download, print, stick it on the wall, and we hope you find it as handy as we do!

Simple SharePoint workflow use case with SharePoint Reminder – Invoice Approvals

Date:May 19th, 2011 Author: Tags: , , ,
Category: General, SharePoint Ideas, SharePoint Reminder Comments:0 ;

Simple SharePiont Workflow - Invoice ApprovalSharePoint Workflows are one of the magic parts of the solution – the bits when even the most cynical and sceptical end user gets to see the benefit.

Instead of emails and bits of paper flying round your organization, getting lost, forgotten and falling between the cracks, everything is managed and driven centrally by SharePoint.

There are a whole load of scenarios where you could use workflows:

SharePoint can handle all of these processes seamlessly and automatically.  Seeking appropriate approvals, escalating, notifying, referring back and reminding as needed, whilst keeping all documentation secure in one central location.

So, that’s the upside.  The downside is that to create a SharePoint workflow you need to use either SharePoint Designer or Visual Studio.  Whilst SharePoint Designer isn’t all that hard to master it is a very powerful tool and capable of doing serious damage in the wrong hands, for this reason many organizations keep it looked firmly away from most users.  Visual Studio on the other hand really is hard to master – strictly for the mega-brains in your IT department.  So this means that cooking up a bit of Workflow magic out of the box is out of the question for most SharePoint users.

The alternative is to use SharePoint Reminder to create your SharePoint workflows. Using SharePoint Reminder and some clever filtered list views you can easily create multi stage workflows to cover any of the scenarios listed above.

This use case walks you through how to create a 2 stage supplier invoice approval workflow, using SharePoint Reminder and a standard SharePoint document library.

Reminder only drives simple workflow, it doesn’t have the advanced logic of SharePoint OTTB Workflows and it won’t do things like automatically updating lists or other systems.  But for a lot of your day to day processes, you might find that it does just what you need.

Download SharePoint Reminder