Eagerly awaited v2 of PivotPoint web part for SharePoint is now available for you to try, or buy.
We think you’re going to like this one.
Some of you will be familiar with PivotPoint already; it lets you summarize complex SharePoint list data by creating Pivot Tables. These update dynamically, as your list data changes. So they are great to use in dashboards for things like keeping an eye on how sales are going, keeping tabs on how your helpdesk is performing, seeing who’s taking way too much sick leave.
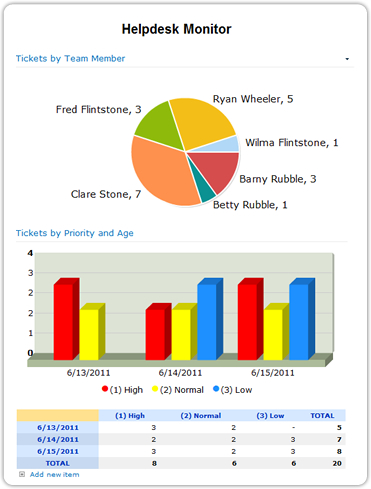
People in the finance sector and statisticians have always been really keen on PivotPoint; they understand how useful Pivot Tables are and feel right at home looking at rows of figures all day. For the rest of us a nice colourful chart tends to make things easier to understand at a glance, so that’s what we have added to PivotPoint version 2.
As well as creating Pivot Tables, which are linked directly to your SharePoint list data and therefore update automatically as your list data changes, you can also create Pivot Charts, which are also linked directly to the list. You can choose bar charts, line charts, column charts, funnels, pies – the world’s your oyster! Color code as you wish, and if you want the visualisation and the detail you can display a chart and a table together.
Another advantage of having the web part directly connected to the list is that we have been able to include drill down, from the chart or table, to a filtered view of the list. So for example when I am looking at my “Sales by Product, This Month”, chart, I will be able to hover over the enormous, sky rocketing column which represents this month’s sales for PivotPoint version 2, click on it, and go directly to a list view showing just the sales records for all the people who have bought PivotPoint this month – how cool is that?
The new version also has other handy features, like export to excel, so that you can do more analysis on your figures if needed, and easy printing, because we know SharePoint generally isn’t all that print friendly.
If you are an existing customer you can upgrade to v2 without disrupting any of your existing settings.
If you’re not a customer yet, well what are you waiting for? Take a free trial and see what your SharePoint deployment is missing!
Tags: PivotPoint, SharePoint 2010


