Update: CrossTab has now been renamed Pivotpoint
This web part gives a CrossTab view of a SharePoint® list helping you to summarize and analyze data.
(CrossTabs are more commonly known from Microsoft Excel® as a Pivot Tables – http://en.wikipedia.org/wiki/Pivot_table)
There are almost limitless ways to use a CrossTab – here is one quick example
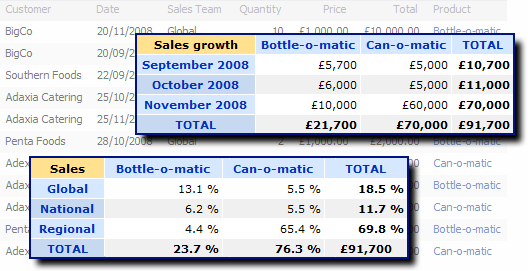
We take a Sales list and first generate a CrossTab showing sales by product over time. We can see a big increase in sales from £11,000 in October to £70,000 in November and most of that increase is due to sales of the “Can-o-matic” product.
The next CrossTab shows the same data by Product/Sales Team expressed as a percentage of total sales. We can immediately see that the Regional sales team and the “Can-o-matic” are a winning combination generating 65.4% of revenue.
Previously you would have to export this data to Excel or use MOSS Enterprise Excel Services to perform the same sort of analysis. Now using the CrossTab web part you can summarize and cross tabulate your data for easy analysis in all versions of SharePoint.
This is one of several new products in the pipeline that we are very excited about – if you would like to help with Beta testing then please get in touch
Tags: Beta, CrossTab, SharePoint, Web Part


